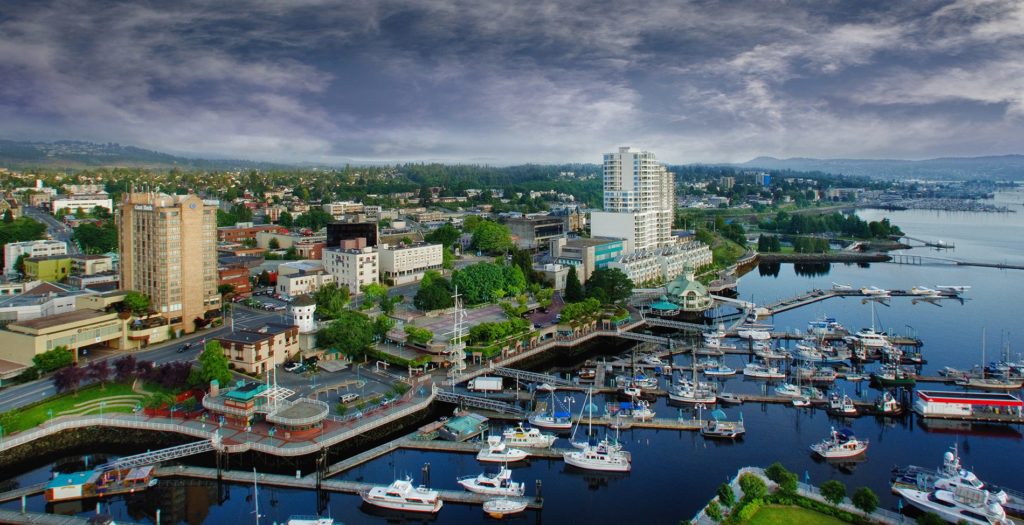
The real estate market is changing constantly, but there are trends we can look at to get a snapshot of the current market and compare it to previous years. The Vancouver Real Estate Board (VIREB) has collected data for the Nanaimo Real Estate market so that we may observe trends and better advise our clients when buying or selling a property. VIREB has put together a comparative infographic comparing August 2017 to August 2016.
It is helpful to review this information so we may attempt to predict the trends that will continue in our market. However, it is important to note that there is no guarantee that things won’t change. Real estate markets can change quickly and without obvious warning for many reasons. The changing price of commodities, foreign trade policy changes, government changes and world events are just a few.
My thoughts? The market has been flat for 7 or 8 years and we have experienced a significant spike in values (15-16% per year) for the last 2-3 years. All indications and predictions by industry professionals lead me to believe that we will see a slow down in the growth to a 4-5% range for the next few years with some analysts predicting a strong market for at least another 5 years.
So what does that mean to you? If you are selling and buying at the same time, it really makes no difference when you buy & sell as both transactions will be in the same market. If you are selling and banking the money, waiting a bit may give you another 4 or 5% but be sure to weigh that against the returns you can get with other investments. Sometimes its better to have the cash on hand.
If you are buying a primary residence or a rental – you should feel secure in your investment. Rental rates are high and with a minimal down payment, rental income can cover all investment expenses and your primary residence will be increasing in value.
Yearly Comparison – VIREB Statistics
Here is the data for the real estate market in Nanaimo from August 2017 compared to August 2016.

There are some interesting things to note here. Firstly, the amount of single family homes sold changed only a small amount, however the prices went up significantly. The average price of a single family home jumped from $455,376 to $518,612 in one year – which is an increase of $63,236 or 13.9% (the average was 15% for last year). This shows us that the market is hot right now and that it is a great time to sell. The days to sell went down significantly for Condo Apartments but maintained consistent for single family homes. North Nanaimo accounted for the highest number of sales with the area around the University coming in as a close second.
The highest demand by buyers has been for ranchers and main level entry homes (extra bedrooms up or down) and as our baby-boomers get older, the need for this type of home will continue to increase. The effect will be that this style of home will increase in value more than any other type – so… considering a Rancher? Buy it now!
One other area to watch is larger townhomes. Again, the same demographic is looking for low maintenance living and wants a comfortable space that is larger than 1200 sq ft. Toss in the need for quality finishing and proximity to shopping and other services, and when these homes come onto the market, they sell very quickly.
Here is a link to the Vancouver Island Real Estate Board statistics page.
Want to chat about your real estate needs, your home and the market? Give me a call/text or email and we’ll grab a coffee.